

lessons learned from five years in the dojo - part 1
Having helped organizations with Dojos for five years, we felt it was the right time to share what we’ve learned so far. In this series of blog posts, we want to offer you our “best tips” for starting your own Dojo or for improving your existing Dojo. We’ll wrap up with our thoughts on where Dojos are going next.
Without further ado…
Dojos Need to Support a Strategy
We talk with many organizations excited about starting a Dojo. The concept of teams learning new skills while building products is enticing and practical. Excitement is great, but Dojos work best when there is an overarching strategy the Dojos serve. Without a strategy, Dojos can flounder.
For example, an organization invested in moving from a project model to a product model would leverage that desired outcome as their strategy for the Dojo to support. The strategy frames the purpose for the Dojo. The Dojo is there to help teams understand how to work in a product model and learn the skills they don’t already have required to work in that model.
Another strategy we often see is leveraging Dojos to adopt DevOps. While this is more narrow than we recommend, it is still a nice frame for what purpose the Dojo is serving. (We prefer to see Dojos address as much of the product development value stream as possible. We’ll cover this in our next post in this series.) A “DevOps Dojo” would focus on helping teams learn how to build continuous delivery pipelines and automate infrastructure setup while foregoing other skills like product discovery practices.
A third example is using a Dojo to help the organization migrate applications to the cloud. This is an interesting start, but for the Dojo to truly be effective the strategy should be clear on how teams should migrate their applications. Will teams refactor applications for the cloud, move them in a “lift and shift” model, or follow a “re-platforming” model? If it’s a combination of those approaches, what are the criteria for determining which migration model for an individual application? And what is more important - having teams leave the Dojo with deep knowledge of the cloud or getting their applications into the cloud with sufficient knowledge of how to support them? Knowing the answer to these questions is critical if you want to use your Dojo to drive toward specific outcomes.
Starting from a sound strategy is key. It provides the following benefits:
Teams understand the value of why they should participate in the Dojo
The skills and topics taught in the Dojo are well-defined
Growing coaches is easier because coaches can focus on specific skills
Measuring the success and impact of the Dojo is easier since you can measure outcomes against the strategy
The strategy your Dojo supports should be clear and easily stated. If the strategy is nebulous or complicated, your Dojo will struggle to provide value to the rest of the organization.
What strategy is your Dojo supporting?
Be on the lookout for our next topic in this series: why Dojos need to address the entire value stream.

Six Reasons Why We Do Two-and-a-Half-Day Sprints in the Dojo
When we’re explaining the Dojo model to people who are unfamiliar with it we often get a lot of head nods and other indicators that people understand the model. They see how it’s different from other approaches to learning. Sadly, most of us have had experience with inadequate training programs...

When we’re explaining the Dojo model to people who are unfamiliar with it, we often get a lot of head nods and other indicators that show people understand the model. They see how it’s different from other approaches to learning. Sadly, most of us have had experience with inadequate training programs. Many of us have worked in organizations who’ve sent hundreds of people through certification courses only to find the desired outcome doesn’t stick or never materializes in the first place. For us, the Dojo model just “makes sense”.
One aspect of the model that does raise eyebrows is the two-and-a-half-day sprints. People often question – “Why two and a half days?”, “Isn’t that too short?”, and “What are the advantages of sprints that long?” (Some even go so far as to say “That can’t possibly work.”)
Here are six reasons why two-and-a-half-day sprints are effective in the Dojo.
1. Repetition Fosters Learning
At our current client, Dojo challenges are six weeks long. Setting the sprint length to two and a half days results in teams completing twelve sprints during their challenge. If we set the sprint length to be two weeks, a common sprint length, the team would only complete three sprints during their challenge.
The two-and-a-half-day sprint format is a vehicle for us to foster learning through repetition. Teams using Scrum, for example, are getting frequent practice with the four core Scrum events (Sprint Planning, Daily Scrum, Sprint Review, and Sprint Retrospective). We’ve found that this interval of repetition helps the practices stick. Teams get better at them than they do if they practice them less frequently.
If a team is working on learning how to improve their CD pipeline, deliver microservices, or deploy to the cloud they also have opportunities for repetitive practice resulting from the two-and-a-half-day format.
Repetitive practice helps new learning stick.
2. Practice Getting to Done
Many of the teams we work with who are presumably already “doing agile” struggle with finishing stories by the end of the sprint. Often times Sprint Planning doesn’t produce a realistic plan, teams don’t allow enough time for testing, or they’re simply too optimistic about how much they can accomplish. All of these things contribute to teams carrying stories over stories from sprint to sprint.
Ron Jeffries advocates for shorter sprints when teams are struggling to finish stories by the end of the sprint.
If you can’t get everything “done” (see above) at your current Sprint length, consider shortening your Sprint. If it’s two weeks, try one week. If you can’t get anything done in one week, try one day.
We’ve seen significant improvements in teams’ abilities to plan and execute a set of stories within a sprint over their six-week Dojo challenges. They come in acknowledging they often don’t complete stories every sprint and leave with the ability to “get to done” on a regular cadence. Often, it takes multiple sprints in the Dojo to make this change but we’ve got twelve opportunities to improve.
3. Teams (Finally) Learn How to Break Stories Down
“Instead of how big, we should be asking is it too big?” – David Hussman.
When it comes to planning sprints in the Dojo, we think it’s more valuable to ask “Can we get this story done in two and a half days?” than it is to ask “How big is this story?”.
Our friend, David Hussman, first got us moving away from focusing on “estimating” to focusing on “sizing”. Put another way, instead of a team getting bogged down in estimation meetings, the team focuses on breaking down stories until they can be done in two and a half days. For us, learning how to do this is significantly more important than learning how to get better at estimating.
Even when teams are delivering using Kanban, or they’re advocates of “no estimates” and use other techniques for predicting delivery timelines, breaking down stories so they can be delivered incrementally is an essential skill.
(For approaches to breaking down stories see this post.)
4. Learning is Supported by a Margin of Safety
There’s a lot of buzz these days about providing safe environments for teams to fail. Modern Agile holds safety as one of its core tenets. DevOps culture teaches us that when we have a problem with our systems we shouldn’t blame individuals, but instead look at the system itself.
Too often, teams are asked to learn while delivering. The message is clear – you have to learn agile/lean methods, or new technology, or new engineering practices – but it can’t impact the delivery timeline. Sadly, this often happens while delivering important or even mission-critical products. This is hardly an environment conducive to learning.
Failure is critical for learning. We learn from our failures and the stories that get created and retold about those failures. Do you remember any stories off the top of your head about a system that was designed so well there were never any outages? You might, but we’re guessing you know a lot more stories about system failures, what caused those outages, and what you learned from them.
In the Dojo, it’s critical to have an environment where failure is not only tolerated but where failure is understood to be a natural part of the cycle of knowledge creation. Without an opportunity for failure, learning becomes stifled. As part of the onboarding process we make sure stakeholders understand that delivery will slow down somewhat to make space for small failures and to make the Dojo a safe place for learning.
Small failures are the key. The two-and-a-half-day sprints provide a safe environment for learning. Failures at any level, whether they are product or technology related, can be corrected quickly. An investment of two-and-a-half-days is usually not very costly to the team.
At the same time, we want to provide opportunities for feedback, reflection on the part of the learner, and immersion back in the work in a timely manner in an environment where the learner feels safe. Two-and-a-half-day sprints help create this feeling of safety.
5. Frequent Retrospectives Lead to the Proper Mindset
Another common problem we run into with teams is they’ve stopped doing retrospectives and as a result have stopped focusing on continuous improvement. When we ask them why we’re told the retrospectives don’t have any value because they keep repeating the same problems over and over.
In these cases, we ask the teams to resume doing retrospectives for the duration of their Dojo challenge. During the retrospective, we ask the team to pick one item to work on improving over the next two-and-a-half days. In cases where the team identifies impediments that are largely beyond their control we ask them to focus on making one improvement within their control.
Sometimes the same idea for improvement will be carried over and continues to be worked on from one sprint to the next. But our experience in the Dojo has been that teams adopt a mindset of continuous improvement more easily than when they’re working within a two-week sprint cadence. The frequency of inspection and coming up with ideas for improvement helps the principle of continuous improvement stick.
We’re not saying every team should adopt retrospectives more frequently than on two-week sprint boundaries. What we are saying is that establishing the mindset is what’s important here.
6. There are More Opportunities to Ask “What is the next best investment in learning?”
An essential skill for Dojo coaches is knowing when to play the role of teacher and when to play the role of a guide who reflects behavior and ideas back to the team. The two-and-a-half-day sprint format provides a natural cadence to move back and forth between those roles.
One question we frequently pose to teams during Sprint Planning is “What’s our next best investment in learning?” The answers vary depending on the teams’ unique challenge goals.
In some cases, teams are focused on learning design thinking and product discovery so the discussion could be about coming up with ways to test a hypothesis about our product. Or, the discussion could be about pivoting to a new product idea entirely.
Other teams might have challenges focused more on learning new technology or engineering practices. For those teams the discussion might center around what stories to complete that will foster the desired learning.
Again, the frequency of stopping to reflect on this question every two and a half days fosters a mindset of thinking about product development and learning as a series of investments.
The six reasons are related and reinforce each other. Together, they help create an environment that supports learning and knowledge creation.
If you have experience with two-and-a-half-day sprints or if you have questions about running two-and-a-half-day sprints we’d love to hear from you.

Measuring Impact In The Dojo
Last month at Agile Day Chicago, I (Joel) had the pleasure of listening to Mark Graban speak about separating signal from noise in our measurements. Mark referenced Process Behavior Charts, a technique described in the book Understanding Variation: The Key to Managing Chaos by Donald J. Wheeler. This simple tool helps us look at metrics over time and understand the difference between naturally occurring variations (what Wheeler calls “The Voice of the Process”) and signals, or variation in the metrics representing real changes. Signals can be indicators that a desired change is manifesting, or they can be indicators that something is wrong and requires further investigation.

Last month at Agile Day Chicago, I (Joel) had the pleasure of listening to Mark Graban speak about separating signal from noise in our measurements. Mark referenced Process Behavior Charts, a technique described in the book Understanding Variation: The Key to Managing Chaos by Donald J. Wheeler. This simple tool helps us look at metrics over time and understand the difference between naturally occurring variations and signals, or variation in the metrics representing real changes. Wheeler calls both of these (signal and noise) “The Voice of the Process,” with the key being able to distinguish between the two. Signals can be indicators that a desired change is manifesting, or they can be indicators that something is wrong and requires further investigation.
We immediately saw the value in being able to separate signal from noise when evaluating the types of metrics we’re capturing in the Dojo that we talked about in our last post. We both grabbed copies of the book, devoured it quickly, and started brainstorming on applications for Process Behavior charts.
Let's look at an example of how to use Process Behavior Charts in the Dojo.
BEFORE YOU START
This may sound obvious, but before you start any measurement think about the questions you want to answer or the decisions you want to make with the data you’ll collect.
In the Dojo, we help teams shift from a project to product mindset. We focus on delivering specific outcomes, not simply more features . When delivering a new feature the obvious question is – did the feature have the desired outcome?
THE SCENARIO
Imagine yourself in this type of situation…
We’re working with a team and we’re helping them move from a project model to a product model. In the past, the team cranked out features based on stakeholders’ wishes and success was simply judged on whether the features were delivered or not. We’re helping the team shift to judging success on whether outcomes are achieved or not.
We’re also working with the stakeholders and there’s resistance to moving to a product model because there’s fear around empowering the teams to make product decisions. New features are already queued up for delivery. Before we give the team more ownership of the product, the stakeholders want delivery of some of the features in the queue.
We can use this as a coaching opportunity.
The stakeholders believe the next feature in the queue will lead to more sales - more conversions of customers. The team delivers the feature. Now we need to see if we achieved the desired outcome.
Our first step is to establish a baseline using historical data. Luckily, we’re already capturing conversion rates and for the 10 days prior to the introduction of the new feature the numbers look like this:

Sample Data Set
Then we look at the data for the next 10 days. On Day 11, we have 14 conversions. Success, right? But on day 12, we have 4 conversions. Certain failure?
Here’s the full set of data for the next 10 days:

Sample Data Set, Next 10 Days After Feature Introduced. Did It Matter?
Overall, it looks better, right? The average number of conversions have increased from 6.1 to 7.9. The stakeholders who pushed for the new feature shout “success!”
PROCESS BEHAVIOR CHARTS
Given a system that is reasonably stable, a Process Behavior Chart shows you what values the system will produce without interference. In our case, that means what values we can expect without introducing the new feature. Let's create a process behavior chart for our example and see if our new feature made a difference.
First Step - Chart Your Data In A Time Series and Mark the Average

Plotting Daily Conversions, Average Marked In Dotted Red Line
What does this show us? Well, not much. Roughly half of our points are below average and half are above average (some might call that the definition of average).
Second Step - Calculate the Moving Range Average
Our next step is to calculate the average change from day to day. Our day to day changes would be 2, 4, 4, 2, 6, 3, 2, 5, 3 for an average change of 3.4. All this means is that on average, we see a change in the number of conversions day to day of about 3. If we were to plot the number of changes in conversion day to day, we would see roughly half above and half below - again, the definition of average.
Third Step - Calculate The Upper And Lower Bounds
To calculate the upper and lower bounds, you take the moving range average and multiply it by 2.66. Why 2.66? Great question - and it is well covered in Don Wheeler's book. In brief, you could calculate out the standard deviation and look at 3 sigma, but 2.66 is faster, easier to remember, and ultimately tells the same story.
We take our moving range average of 3.4 and multiply it by 2.66 giving us 9.044. What does this number mean? It means that with normal variance (the Voice of the Process), we can expect conversions to fluctuate 9.044 above or below our average number of conversions which was 6.
To put it more clearly, without any intervention or new features added, we should expect between 0 and 15 conversions per day - and that would be completely normal.
Let's visualize this data. We add our upper and lower bounds to our chart for our first 10 days. It now looks like this:

Data With Process Control Limits Applied. UPC - Upper Process Control, LPC - Lower Process Control. NOTE - Since the LPC is actually -3, we use 0 since a negative is not possible
Fourth Step - Introduce Change & Continue To Measure
We have established the upper and lower bounds of what we can expect to happen. We know that after the feature was introduced, our conversion numbers looked better. Remember, the average went up almost 30% (from 6.1 to 7.9) - so that is success, right?
We extend our chart and look to see if the change actually made a difference.

Conversion Chart With Upper And Lower Process Controls. Note - Average, UPC, and LPC Were Not Updated With New Data Points To Prove The Next 10 Days Fell Within Previous Dataset Limits
Our average for the next 10 days was higher, but looking at what we could normally expect the system to produce, all of the conversions were within the expected range. In essence, the feature we delivered did not create a meaningful impact to our conversions.
Note, we’re not saying that nothing could be learned from delivering the new feature. The point we’re making is that prior to delivering the feature we assumed it would lead to an increase in conversions. Using a Process Behavior Chart we were able to show our assumption was invalid.
Now we can continue the conversation with the stakeholders around empowering the team to improve the product. Maybe now they'll be more open to listening to what the team thinks will lead to an increase in conversions.
MORE USES FOR PROCESS Behavior CHARTS
We like using this visual display of data to help us concretely answer questions focused on whether or not our actions are leading to the intended outcomes. For example, we are experimenting with Process Behavior Charts to measure the impact of teaching new engineering and DevOps practices in the Dojo.
REMEMBER - MEASURE IMPACTS to the WHOLE Value Stream
Process Behavior Charts can be powerful, but they require that you ask the right questions, collect the right data, AND and take the right perspective. Using a Process Behavor Chart to prove a change is beneficial to one part of the value stream (e.g., the “Dev” group) while not taking into consideration the impact to another group (e.g., the “Ops” group) would be missing the point. Consider the complete value stream when you are looking at these charts.
FURTHER READING
For more information on these charts, as well as the math behind them and what other trends in data are significant, we recommend the following:
Understanding Variation - The Key To Managing Chaos; Don Wheeler
Lean Blog - Mark Graban, in particular this post on home runs in the World Series
Process Behavior Charts (also called Shewhart Charts) – this article talks about various patterns that are statistically significant
If you found this helpful and you adopt Process Behavior Charts, please let us know how you are using them and what you are discovering.

Dojo Metrics - Moving From What is Easy to capture to What Matters
A fair question to ask when starting a Dojo (or any initiative for that matter) is “how do we know this is working?” Invariably, right on the heels of that question somebody always brings up the idea of capturing metrics. Then they turn to us and say “What are the right metrics for the Dojo?”.

A fair question to ask when starting a Dojo (or any initiative for that matter) is “how do we know this is working?” Invariably, right on the heels of that question somebody always brings up the idea of capturing metrics. Then they turn to us and say “What are the right metrics for the Dojo?”.
The best metrics provide insights that help us take action to improve the current situation. In the case of a new initiative like a Dojo, that action might be making a decision to continue the initiative, modify it, or end it.
Sadly, metrics are often arbitrary or they tell an incomplete story. Single metrics fail to capture the interplay and tradeoffs between different metrics. We’ve heard many stories of how organizations optimizing for one metric created detrimental results overall. (We’re looking at you, capacity utilization.)
how do we measure the effectiveness of the Dojo?
The primary goal of the Dojo is to foster learning. We need to measure the effectiveness of that learning and ultimately, we need to measure the economic impact that learning has on the organization. But it’s not learning at any cost. We’re aligned with Don Reinertsen on this point.
In product development, neither failure, nor success, nor knowledge creation, nor learning is intrinsically good. In product development our measure of “goodness” is economic: does the activity help us make money? In product development we create value by generating valuable information efficiently. Of course, it is true that success and failure affect the efficiency with which we generate information, but in a more complex way than you may realize. It is also true that learning and knowledge sometimes have economic value; but this value does not arise simply because learning and knowledge are intrinsically “good.” Creating information, resolving uncertainty, and generating new learning only improve economic outcomes when cost of creating this learning is less than its benefit."
Don Reinertsen - "The Four Impostors: Success, Failure, Knowledge Creation, and Learning"
Reinertsen stresses the need to generate information efficiently. This is easy to understand when thinking in terms of generating information that helps you make decisions about your product. For example, it’s a fairly straightforward exercise to determine the costs for generating information by running low-fi, paper prototype tests that answer the question “should we include this feature or not?”
It’s also easy to understand how you might measure the effectiveness of knowledge creation when helping teams make improvements on their continuous delivery pipelines. We can calculate the cost of learning DevOps practices and compare that to expenses saved by automating manual processes.
What’s not as easy to understand is how to measure the impact of learning cloud native architecture or micro services - or something even more nebulous, like product thinking and the impact of learning a design practice like personas.
We would expect the impact of these learnings to result in lower development costs, decreased cycle times, and increased revenues resulting from better market fit for our products. But – there is a high degree of uncertainty as to the level of impact these learnings are going to have on the organization. (Again, hat tip to Don Reinertsen. His post about looking at the economics of technical debt influences our thinking here.)
In addition, during a team’s tenure in the Dojo it’s quite probable that their productivity will decrease as the team is creating new knowledge and incorporating new practices. The team's investment in learning carries a cost.
Ultimately, we need to understand the impact the Dojo has on lifecycle profits. That impact will often occur after a team has left the Dojo.
We have started organizing metrics in the Dojo into three groups. Our goal is to help orient stakeholders, leaders, and teams around what actions these metrics will help them take. We also want to help them understand the level of effort required to collect the metrics and the timeframes in which they will be available.
Three Categories of Metrics for the Dojo
Simple To Capture - Organizational Reach
These metrics simply show the amount of “touch” the Dojo has.
Examples include:
Number of teams going through the Dojo
Total number of attendees
Number of Programs / Portfolios touched
Astute readers may critically call these “vanity metrics” and they would not be wrong. These metrics do not equate to impact. They don’t help us answer the questions “Were the right teams involved?”, “Did the amount of learning that happened justify the investment?”, or “How much learning stuck?”
However, these metrics are simple to collect and can be used as leading indicators once we have metrics on the economic impact the Dojo has on teams. For many organizations, these metrics are important because they imply value as the Dojo is being bootstrapped, even though they don't prove it. They are metrics everyone is comfortable with.
Harder To Capture – Directional/Team Based Improvements
Metrics in this category are more important than the previous category in the sense that these metrics look at the directional impact of learning in the Dojo and how that learning is impacting teams.
Examples include:
Number of automated tests
SQALE code quality index
Percentage reduction in defects
Cycle time reduction to deliver a product increment
Velocity / Story count (with the obvious caveat that these can be easily gamed)
Again, these metrics are far from perfect. The testing related metrics do not prove the right tests were written (or the right code for that matter). Metrics showing products were built faster don’t shed any light on whether those products should have been built in the first place (what if nobody buys them?).
What these metrics do show is the incorporation of product delivery practices that are being taught in the Dojo - practices that our experience and the experiences of other organizations have shown to have a positive impact on lifecycle profits. These metrics can be collected with agile project management software, SonarQube, Hygieia, or other comparable tools.
When we use these types of metrics we need to have a baseline. It’s helpful to have data for teams for two to three months prior to when they enter the Dojo. We don’t always have this baseline, however, and in some cases the best we can do during a team’s tenure in the Dojo is help them establish the baseline. Obviously, we want to track these metrics for teams after they’ve left the Dojo to see how well new practices are sticking.
Difficult To Capture – Impact/Economic Improvements
Metrics in this group are challenging - not only to collect but also because using them to drive action challenges the way many organizations work. These are the metrics that force us to look at the question “Is this initiative having a positive economic impact on the organization?”
Examples include:
Increase in sales conversion
Cycle time reduction for a delivery with impact (not just delivery, but a delivery that mattered)
Systematic cost reductions (not silo optimizations that may have detrimental effects in other areas)
Savings resulting from killing bad product ideas early in the discovery/delivery cycle
Metrics like these can prove initiatives like the Dojo are having a positive impact on lifecycle profits. These metrics will be substantially harder to collect. We need to collect data for a much longer period of time. We need to align with the finance department in our organizations. And, we need whole product communities aligned around a shared understanding of what successful outcomes look like. In addition, we need to understand how to separate real signals of change from noise. (This post has more on that topic.)
Ultimately, this last category of metrics is what matters. This is where the Dojo shines. We work with teams to teach the practices, thinking, and communication strategies that will have an impact on lifecycle profits.
This is an ongoing area of improvement for us. This is what we are currently practicing. These categories of metrics are helping foster conversations, understanding of what knowledge individual metrics can provide, and the value of investing in the Dojo.
Empowering & Enabling Responsibility
Empowering teams is a topic the DevOps and Agile communities frequently talk about. But it is easier said than done. Here is one simple approach to empowering teams you can do right now.
But first a little background...

Empowering teams is a topic the DevOps and Agile communities frequently talk about. But it is easier said than done. Here is one simple approach to empowering teams you can do right now.
But first a little background...
Responsibility vs Accountability
We frequently work with leaders who are new to DevOps. We ask them straightforward questions such as - “Why are you interested in DevOps?” We often hear answers along the lines of “We want to make teams more accountable for their actions.” When we dig in a bit further, we learn this is not actually what they mean. What they are trying to say is that they want to empower teams with responsibility for their own work.
What’s the difference between accountability and responsibility? Look up the definitions and you might find yourself going back and forth between them endlessly. It’s as if you are trying to navigate through an M.C. Escher drawing.
For us, being accountable means you’re answerable for something. In its worse form, a leader makes the team answerable for an outcome that is beyond their control to influence. It can come from command-and-control style of leadership. If you’ve ever been held accountable for meeting a goal without the ability to influence how to accomplish it, you know what we mean.
Being responsible means you have the competency, authority, and the correct understanding of the desired outcome so that you can deliver that outcome as you see fit.
When we discuss this topic with leadership, we often use Christopher Avery's work around the responsibility process. It’s an effective conversation starter that helps shift the focus away from accountability toward responsibility.
With that context out of the way, let's look at the one simple thing you can do to empower teams.
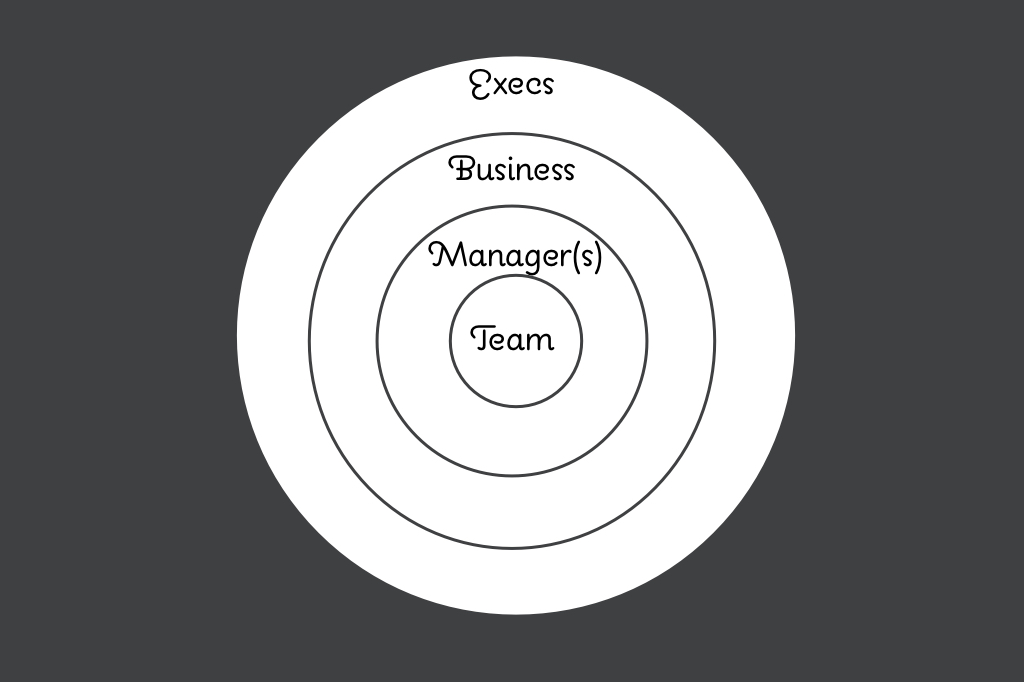
Decision Rings
The image above is something you can refer to with your leaders, coaches, and teams. In this example, the center circle is the team, the next outer circle is their manager(s), the next outer circle is domain experts from the business, and the outermost circle is some executive leadership.
The rings represent different levels in an organization. We use them to help frame discussions when asking “Who can make this decision?” The decision making structure in your organization may be different. The decision making structure may also change depending upon the question at hand.
Let's look at an example. Imagine your product team is working on the goal of increasing sales by delivering promotional content in banner ads. After starting to work on that goal, the team uncovers a better way of improving sales with promotions that has nothing to do with banner ads. Who makes the decision on what to deliver?
First, we make sure we agree where that decision is made today – and we’re not talking about where it’s “officially” made according to some policy. We’re talking about where it’s actually made given the messy, often political nature of decision making within organizations.
Next, we ask “what information would need to be made available or what competency would need to be developed to move that decision inward?” We can then get to work making any necessary changes. Or, we can move the decision-making authority inward if no changes are necessary.
In the above example, we might say “Right now, the business team needs to make that decision. For the product team to be able to make that decision, we would need to provide them more information on the organization’s strategic goals.”
We have just started exploring using this technique in the dojos and it is driving productive conversations. It is not a silver bullet, but it’s a nice simple visual that starts conversations driving empowerment and growing responsibility.
Try it out. Let us know how it works for you.